Analytics
The Analytics Dashboard offers at a glance insights to your platform. At the top you can see 3 numbers that represent user engagement in the current month compared to the last month.

Analytics Dashboard
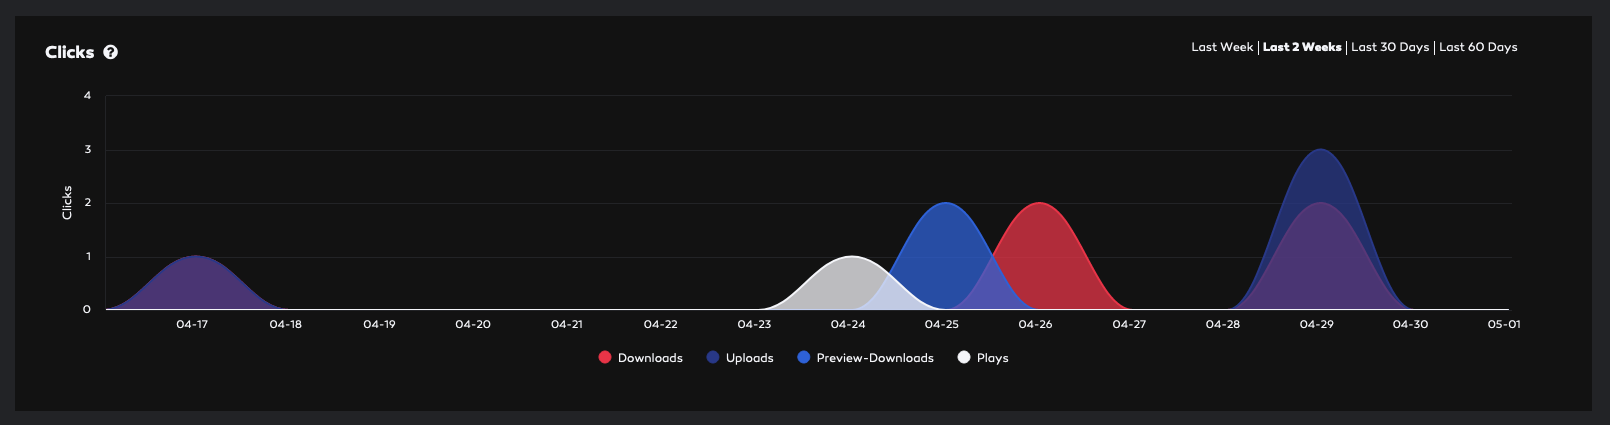
The first graph is a compound chart showing "plays", "downloads" (high- and low-res) and "uploads".
You can select the period in the upper right corner of each chart:
last week
last 2 weeks
last 30 days
last 60 days
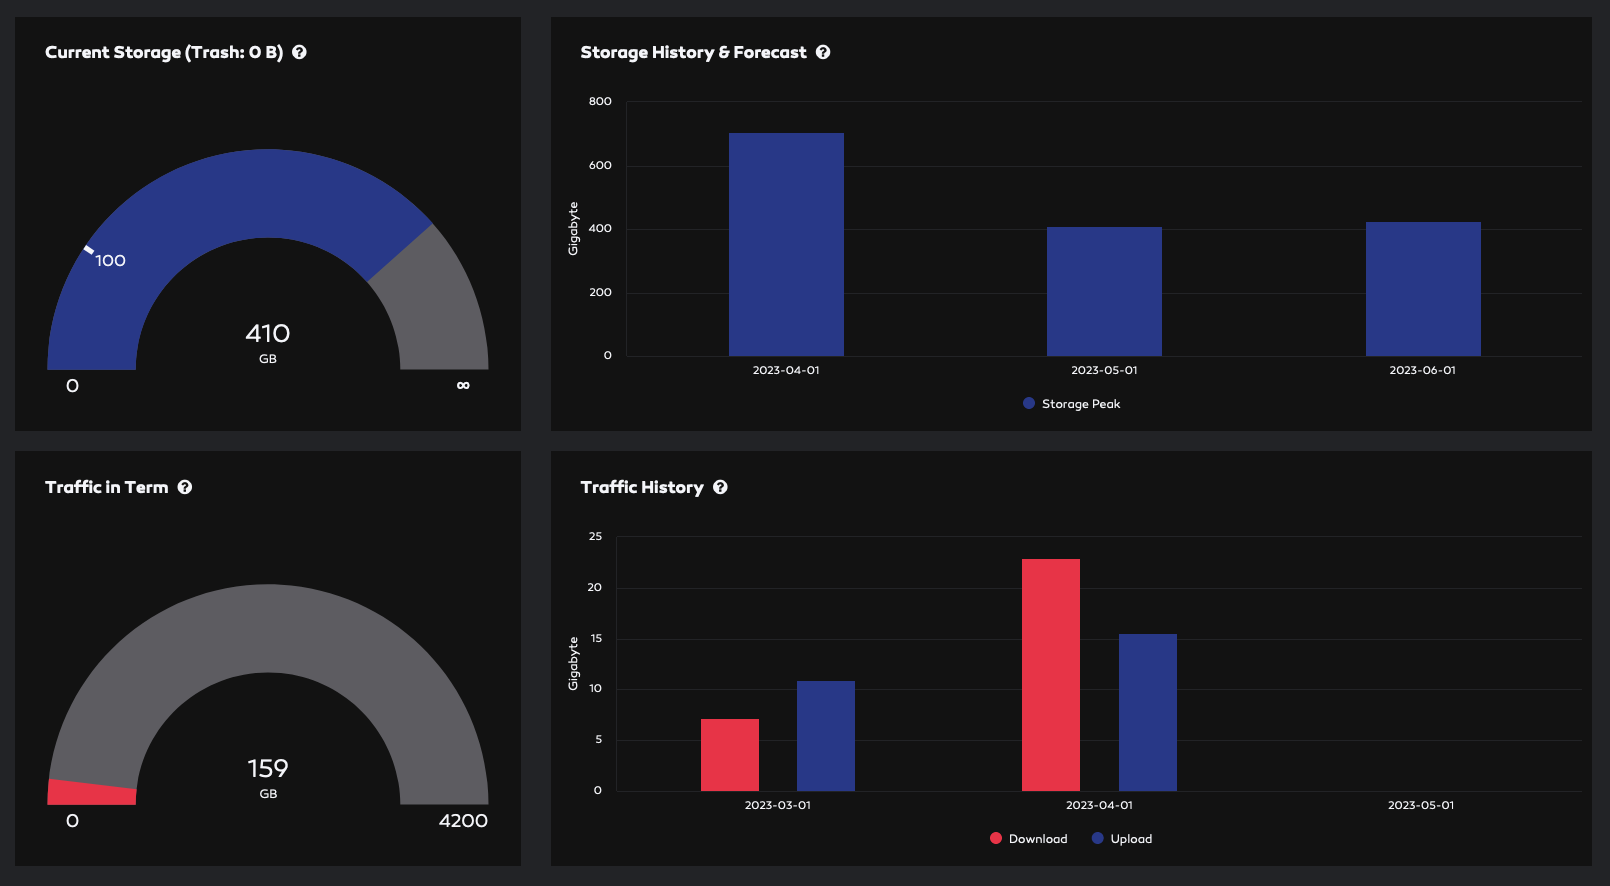
The charts following show the "current traffic and storage" as well as "traffic history" and "storage history & forecast".
The storage forecast is your indicator to estimate your costs for the next month:
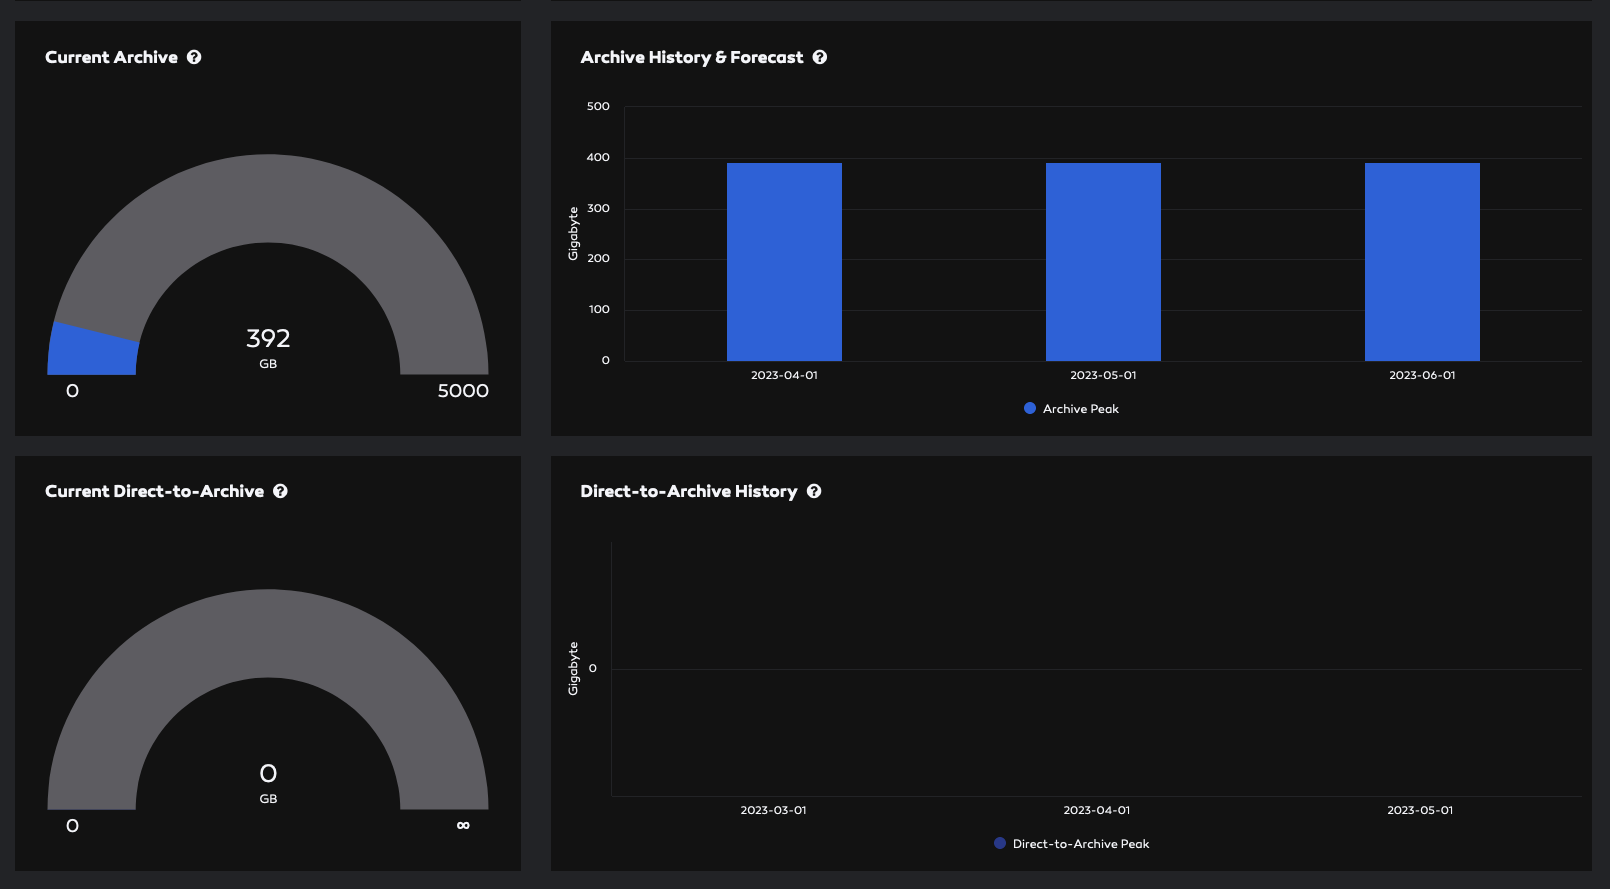
The next charts show the same, but for archive and direct-to-archive:
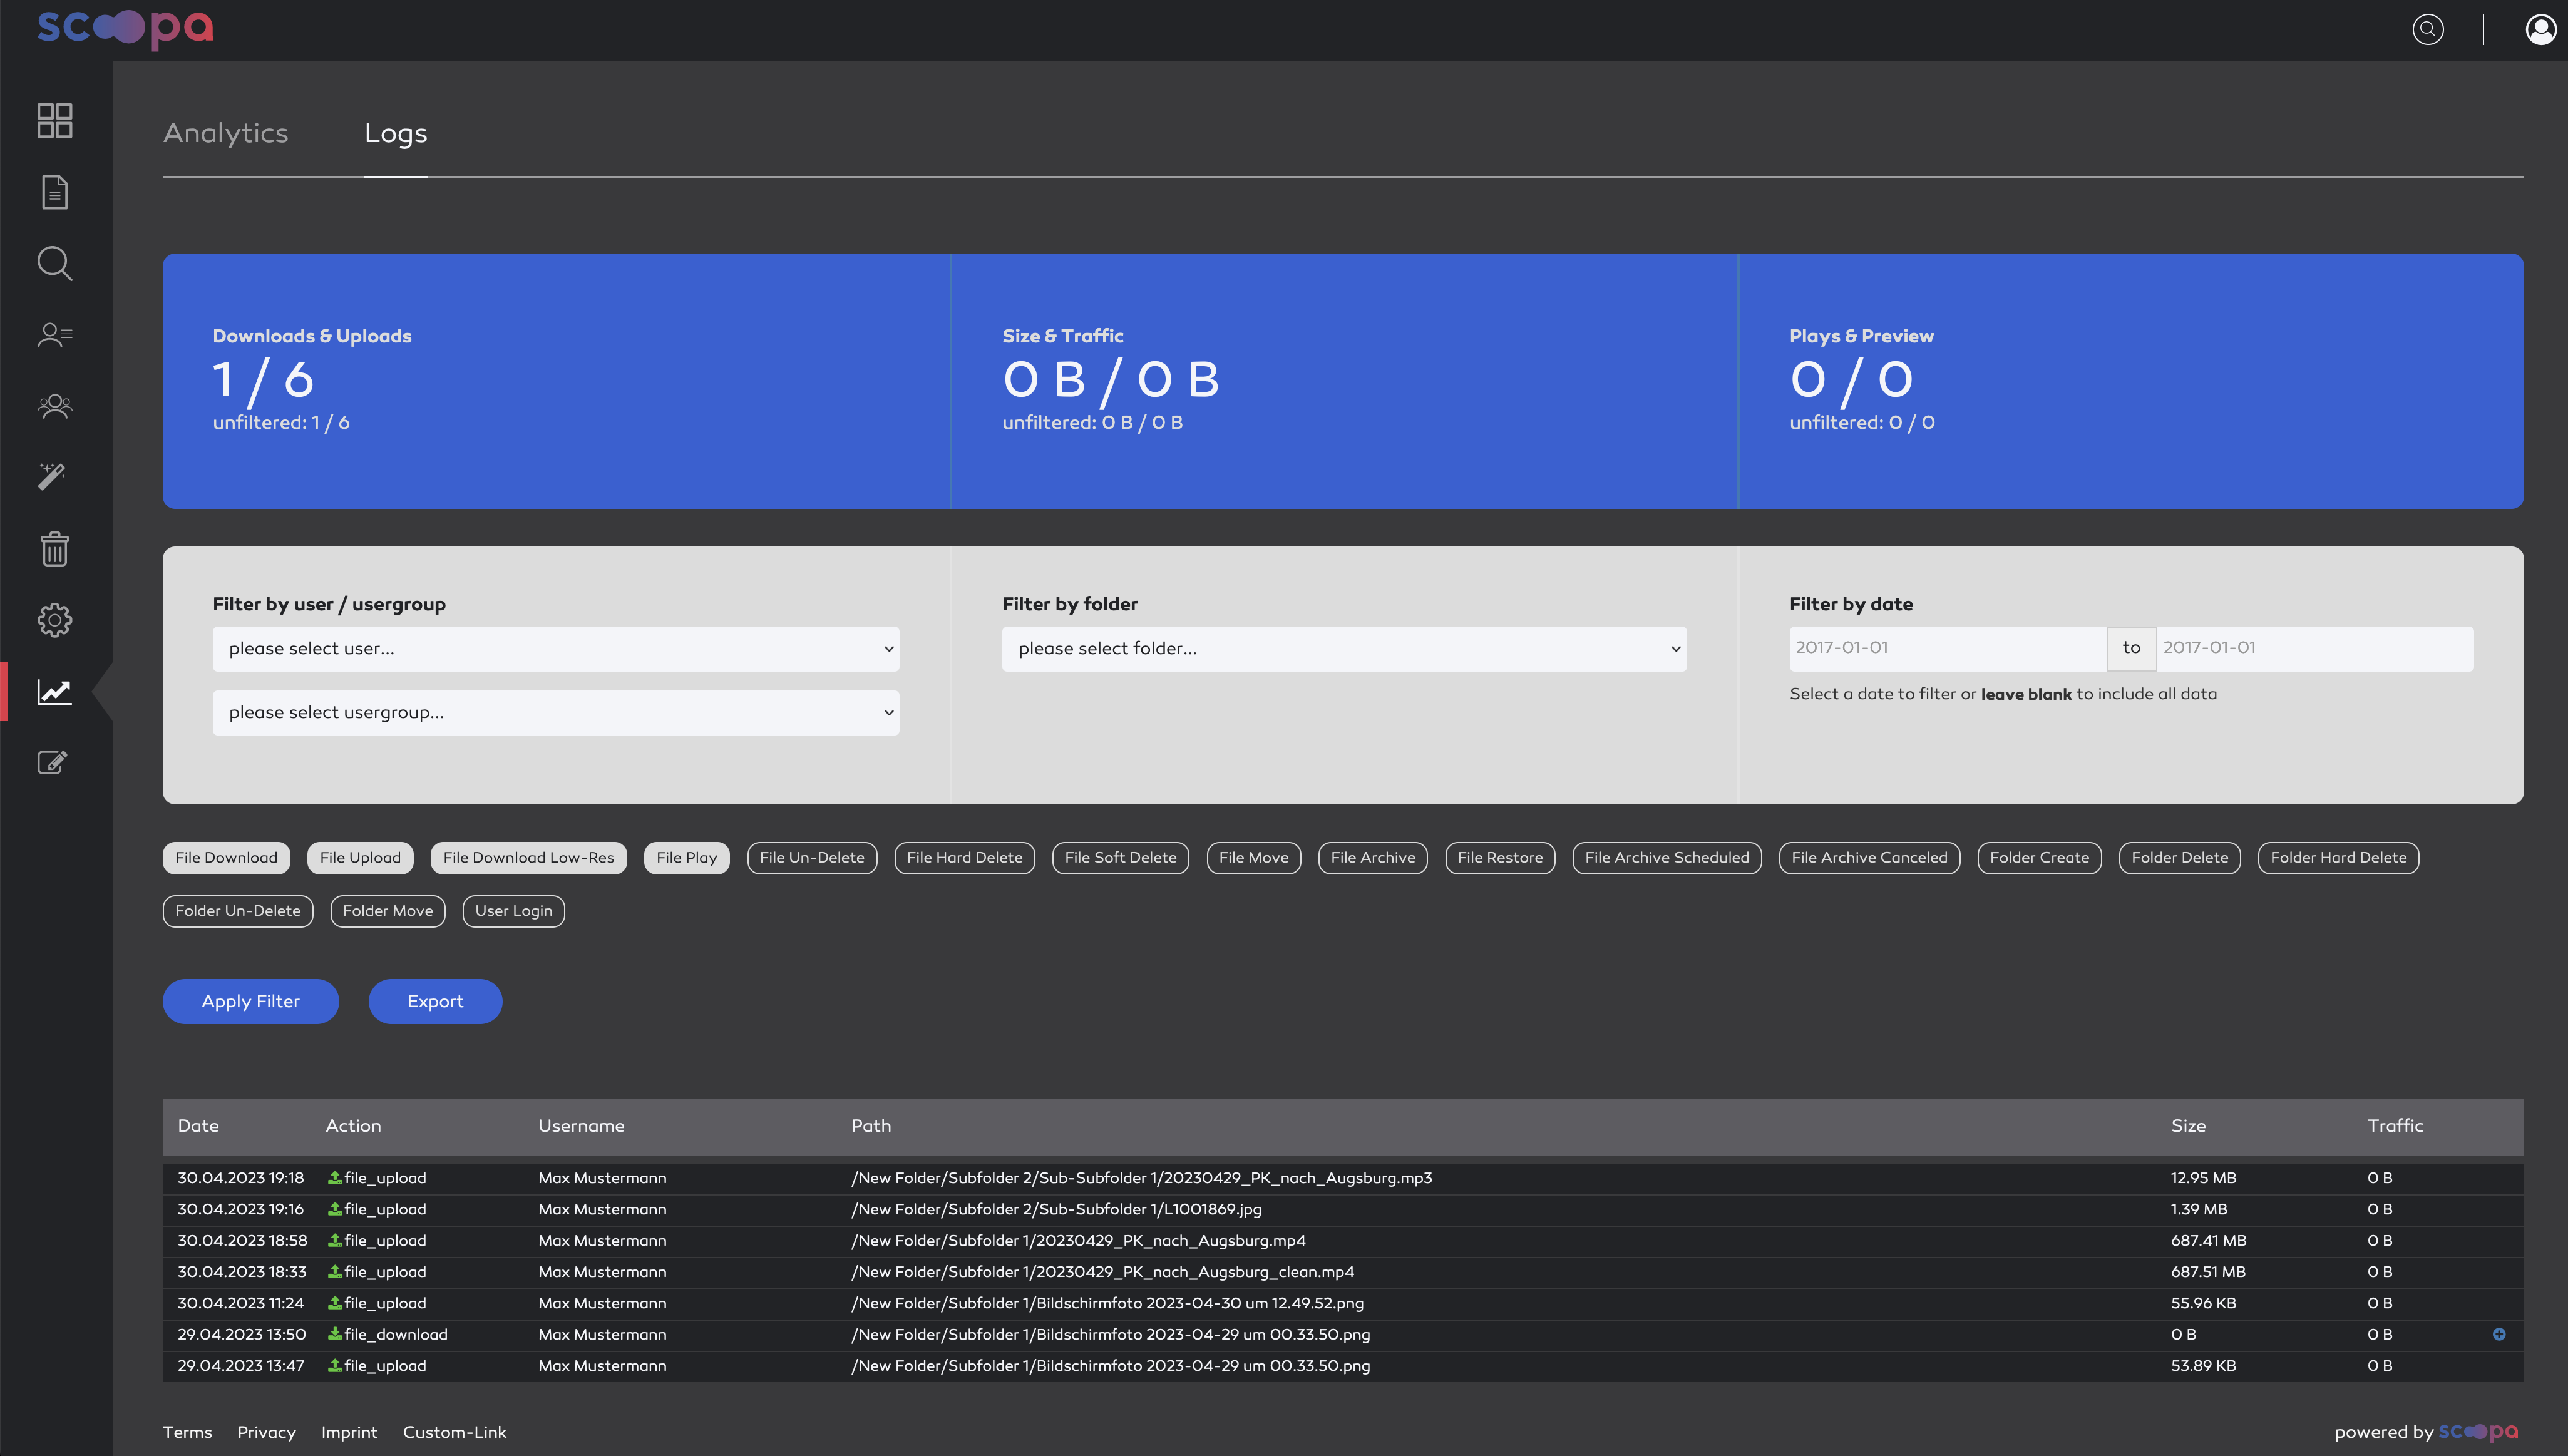
Lastly there are 2 lists showing the Top 10 downloaders and downloads.